
| Home > Products and Services > PEXQ™ |
| > Product Overview | PEXQ is OPTICOM’s latest product for Windows offering a complete portfolio of quality measurement tools for voice, audio/visual and data payload analysis based on human perception. PEXQ provides mandatory features in the area of R&D for the development of new multimedia codecs as well as for multimedia equipment manufacturers. Besides lab testing PEXQ is also ideal for network operators and carriers to measure quality of service. PEXQ is founded on well established internationally standardized measurement algorithms such as PESQ (ITU-T Rec. P.862, P.862.1 (narrow band), P.862.2 (wide band); Perceptual Evaluation of Speech Quality) and completely new metrics for video quality testing like PEVQ (Perceptual Evaluation of Video Quality). |
|||||||||||||||||||||||
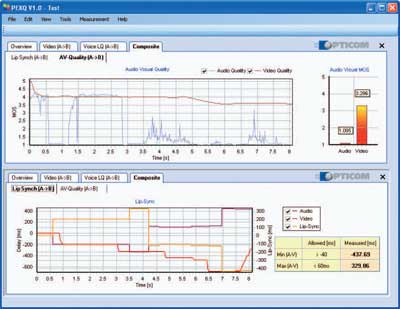
| > New in PEXQ: |  click to [ enlarge picture ] Composite result view for Audio-Visual Quality testing reporting Audio and Video MOS KPIs (upper diagram) and detailed lip-sync analysis window (lower diagram) |
|||||||||||||||||||||||
| > The PEXQ feature overview: |
|
|||||||||||||||||||||||
| > Future versions of PEXQ will also include: |
|
|||||||||||||||||||||||
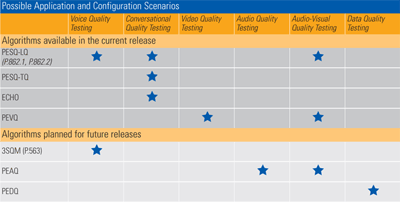
| > Possible Application and Configuration Scenarios: |  click to [ enlarge picture ] The table above provides you with an overview of the currently employed and future features of PEXQ. |
|||||||||||||||||||||||
| > The following PEXQ product versions are available: |
*The OPTICOM Advanced OEM Developer Toolkit is a set of software libraries containing measurement and signal preprocessing algorithms. OPTICOM’s OEM software libraries are available for Windows and Linux. |
|||||||||||||||||||||||
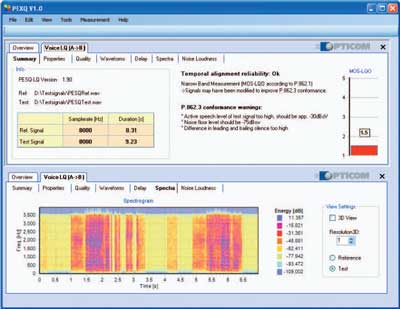
 click to [ enlarge picture ] PESQ Analysis of Listening Quality (upper diagram) with Spectrogram of test signal (lower diagram). Note the easy configurable tab selection for multifaceted result views. |
||||||||||||||||||||||||
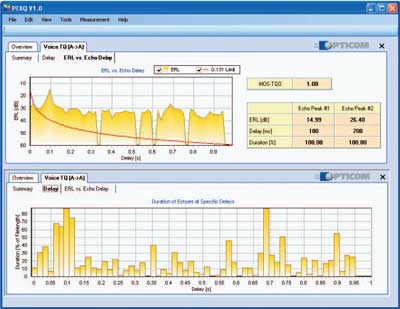
 click to [ enlarge picture ] Comprehensive analysis of Talking Quality: Echo Return Loss analysis and PESQ-TQ MOS (upper diagram), Echo Delay Histogram (lower diagram) |
||||||||||||||||||||||||
| > Download more detailed information |
|
|||||||||||||||||||||||
| [top] | ||||||||||||||||||||||||

